
“An area, as perceived by people, whose character is the result of the action and interaction of natural and/or human factors.”
Landscape is defined in terms of human perception.
But how do people see landscape? Can we measure it?Can we discover patterns that make places what they are?
Computer vision models let us compare visual qualities across millions of photographs, revealing patterns from individual scenes to geographic regions.
Explore a photograph →Explore in 3D ↗Discover the findings →
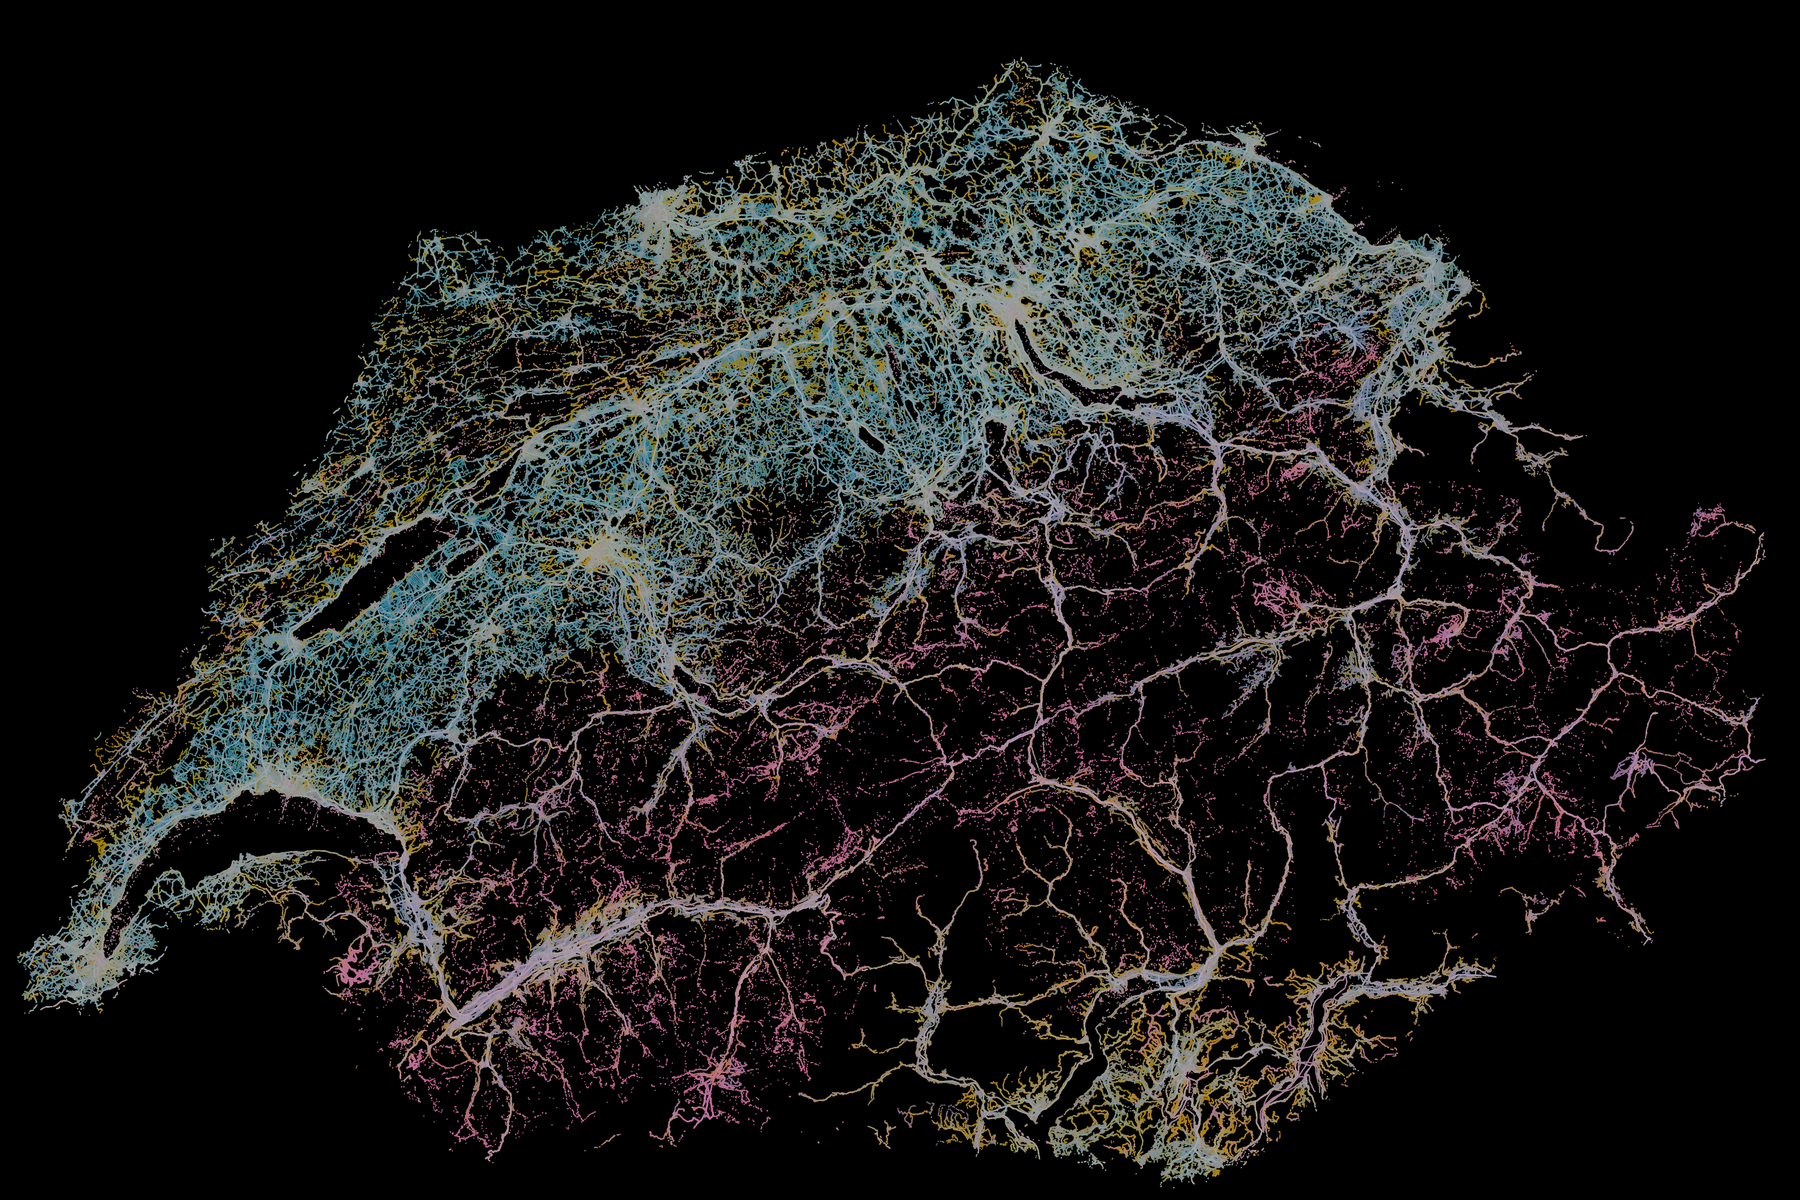
Where does our model recover human-perceived differences in the landscape?
Colour shows visual resemblance; height shows how closely profiles recur in distant places.
Explore in 3D ↗ 02 / AtlasExplore Switzerland’s landscapes
Compare visual profiles, geographic regions and directions, with the photographs and words behind them.
Explore the maps ↗ 03 / CitiesLook closer, city by city.
Explore 15, 10 and 5 km views over aerial imagery.
Choose a city ↗What makes this possible
From small visual qualities
to territorial patterns
Vision transformers measure small image patches. Their recurring combinations describe whole scenes and, in turn, territorial patterns.
Follow a photograph through the method →Landscape Index · photo-led exploration
What visual patterns recur in this photograph?
See which parts of a photograph carry visual features, compare recorded views, and explore a national map of similar visual contexts.
01 / Begin with a photograph
Follow its visual evidence.
Choose a JPEG, PNG or WebP image. Compare its original crop with measured cell maps, then follow a feature across Switzerland.
Uploaded photographs are stored on the analysis server. Use images you are comfortable submitting. The modelled map shows similar visual contexts, not where your photograph was taken.
Connect the service to start.
02 / Across Switzerland
Where is this pattern observed?
The map will show recorded photographs and their pattern membership when the service is connected.
Modelled visual context is available only after a photograph has been measured by the national predictor.
Pan or zoom to explore recorded geography.
No map data loaded.
How to read this map
Colours describe photographed observations in each display cell, with the number of photographs as the denominator. They do not estimate land-area prevalence or the location of the uploaded photograph.
03 / Inside this photograph
Visual features across image cells
The analysis divides the scored crop into 8 × 8 cells. Compare the photograph with one measured feature at a time.
04 / Image parts
Explore image features
Select a feature to highlight the cells where it responds. Feature numbers identify measurements, not named objects.
05 / Embedding maps
Visual direction maps
06 / Recurring combinations
Recurring combinations
These combinations connect measured visual directions. Select one to explore its recorded Swiss examples.
07 / Compare photographs
Similar recorded views
These are nearby profiles in the reference bank, with each match tied to its original capture. Content, arrangement and the joint profile can differ.
Use this photograph to inspect visual relationships and find comparable conditions within the 15 km Biel/Bienne frame.
Opening the explorer…
Cities
Explore the urban landscape.
Choose a city, then adjust the region detail and compare it with aerial imagery. Explore centred 15, 10 and 5 km views; the map identifies when a smaller study area uses its own regional hierarchy.